ESRS E1: Climate Change
Impacts, Risks, and Opportunities
| Material impacts, risks and opportunities in respect of "Climate change" | |||||||
|---|---|---|---|---|---|---|---|
| Type | Description | Time horizon1 | Location2 | Financial effect | Policies | Actions | Targets |
| Climate change adaptation | |||||||
| Risk | Physical climate risks may have financial effects as a result of damage to assets and business disruptions at sites of Covestro. | M, L | 2 | Financial position, financial performance | |||
| Climate change mitigation | |||||||
| Impact (potential negative) | Due to the production, storage, and use of renewable energy and the related electrification in the upstream value chain, Covestro is directly linked to potential negative impacts on the environment. These activities often involve extracting minerals like lithium for batteries and rare earth elements for wind turbines, leading to habitat destruction, soil erosion, and water pollution. Affected stakeholders include local communities, persons in vulnerable situations, and nature. | M, L | 1 | ||||
| Impact (potential negative) | Covestro contributes to a potential negative impact on biodiversity loss as the downstream transportation, processing, and usage of goods increase greenhouse gas emissions and contribute to climate change. Affected stakeholders are local communities, persons in vulnerable situations, and nature. | M, L | 3 | Sale of products based on alternative raw materials; reduction of suppliers’ Scope 1 and Scope 2 emissions; MAKE projects; further actions | Net-zero Scope 3 GHG emissions | ||
| Impact (actual negative) | Covestro is directly linked to the undertaking’s own operations, products, or services in the upstream value chains through its business relationships and the GHG emissions created as a result. This is reflected in Scope 3 upstream emissions, e.g., in the categories Scope 3.1 Purchased goods and products or Scope 3.4 Upstream transportation and distribution. An actual negative impact from climate change resulting from increased levels of GHG emissions indirectly induces effects on health, resources for livelihood or living space, such as: extreme weather events, changed weather patterns, sea level rise, and related social and geopolitical conflicts. Affected stakeholders are local communities, persons in vulnerable situations, and nature. | S, M, L | 1 | Sale of products based on alternative raw materials; reduction of suppliers’ Scope 1 and Scope 2 emissions; MAKE projects; further actions | Net-zero Scope 3 GHG emissions | ||
| Impact (actual negative) | Covestro contributes to climate change through GHG emissions from own operations (Scope -1 and Scope -2). This negatively impacts nature and indirectly impacts local communities. | S, M, L | 2 | CO2 roadmap; HSEQ management system | More sustainable production processes, electricity from renewable sources; climate-neutral steam | Net-zero Scope 1 and Scope 2 GHG emissions | |
| Energy | |||||||
| Impact (potential positive) | Covestro contributes to reducing GHG emissions through its intention to purchase more renewable energies for its own business activities and in this way make a contribution to the potential positive impacts in the upstream value chain. This affects nature and local communities. | S, M, L | 1 | CO2 roadmap; HSEQ management system | Electricity from renewable sources; climate-neutral steam | Net-zero Scope 1 and Scope 2 GHG emissions | |
| Impact (actual negative) | The operation of our production facilities requires large amounts of energy, which we primarily procure from external sources in the form of electricity and steam generated from fossil fuels. This process leads to the release of a wide range of environmentally harmful gases, including carbon dioxide (CO2). They have an actual negative impact on climate change. Affected stakeholders are local communities, persons in vulnerable situations, and nature. | S, M, L | 1 | CO2 roadmap; HSEQ management system | Electricity from renewable sources; climate-neutral steam, more sustainable production processes | Net-zero Scope 1 and Scope 2 GHG emissions, energy efficiency target | |
1 Time horizon broken down into short-term (S), medium-term (M), and long-term (L).
2 Location within the value chain divided into upstream value chain (1), own operations (2), and downstream value chain (3).
For further information, please refer to “Impact, Risk and Opportunity Management.”
For further information, please refer to “Strategy – Interests and Views of Stakeholders.”
Strategy
Our Transition Plan for Climate Change Mitigation
Our goal of transforming to climate neutrality is intended to prepare us for the future, mitigate the material impacts and risks identified, and actively take advantage of opportunities by manufacturing our products in a climate-neutral manner. For Covestro – an energy-intensive company with complex value chains – this means not only systematically driving energy efficiency, establishing more sustainable production processes, and using climate-neutral sources of energy, but also moving away from the use of fossil-based raw materials and embracing a holistic approach toward more sustainable production and business models. This transition will help us launch climate-friendly products on the market and meet specific climate targets.
In accordance with the Intergovernmental Panel on Climate Change (IPCC) and the United Nations Framework Convention on Climate Change (UNFCCC), we understand and support climate neutrality as society’s collective goal of attaining net zero GHG emissions by the year 2050. This means that anthropogenic emissions can be removed by the planet through its natural ability to absorb them and as a result no longer impact on the climate. The time horizons of our climate targets are therefore defined in such a way that they conform to international and European ambitions to limit global warming to the 1.5°C required under the Paris Agreement.
In order to achieve our net-zero target at all environmentally relevant sites in respect of emissions from our own production (Scope 1) and emissions from the use of energy produced outside the company (Scope 2) by the end of 2035, we have defined three levers. We are planning to optimize our production processes to facilitate the more sustainable and energy-efficient manufacture of our products. In addition, we intend to increase significantly the proportion of electricity from renewable sources. We likewise aim to make greater use of climate-neutral steam in future.
In addition, we have identified four key levers for reducing emissions from upstream and downstream processes in the value chain (Scope 3). The first lever is that suppliers reduce their Scope 1 and Scope 2 emissions. Many of Covestro’s raw material suppliers have already defined their own Scope 1 and Scope 2 targets, which could contribute in turn to Covestro’s Scope 3 targets. The second lever is the profitable sale of products based on alternative raw materials. The third lever consists of our MAKE projects – investment projects for the manufacture by Covestro of alternative raw materials with a small carbon footprint. The fourth lever concerns a large number of different factors, e.g., increased recycling rates and changes in logistics and primary energy generation.
To enable the company to achieve net zero for Scope 1 and Scope 2 emissions at all environmentally relevant sites, Covestro anticipates investments of between €250 million and €600 million for more sustainable production processes by the year 2035. Greater energy efficiency is expected to cut operating expenses by €50 million to €100 million a year. Conversely, on the road to net-zero emissions, Covestro is anticipating higher annual operating costs for the procurement of renewable energy in a low three-digit million euro amount. These cost assumptions are based on past experience that prices for fossil-based sources of energy are lower than for renewable energy.
In the short term, Covestro does not anticipate any significant additional operating costs in order to achieve its Scope 3 targets. By the year 2035, we will invest approximately €600 million in our own recycling and bio-based technologies (MAKE projects). It is still necessary to evaluate additional operating costs and investments in the short and medium term. At present, it is difficult to quantify these investments because of the still high degree of uncertainty regarding the maturity of technologies, regulations, and customer requirements.
The investments required are an integral part of resource and allocation planning and dedicated to specific projects.
This dedicated allocation of capital expenditure (CapEx) to CO2 roadmap and MAKE projects can enable Covestro not only to achieve an efficient and cost-effective transformation, but also to deploy future-oriented technologies.
We seek to avoid any significant increases in GHG emissions in new investments by way of high heat recovery rates, the use of state-of-the-art process technologies, and a future-oriented infrastructure. When calculating our climate targets, we took account of increases in annual GHG emissions resulting from our growth strategy.
We see no risks to target achievement from locked-in emissions because Covestro can use existing facilities to make products with sustainable properties for its user industries. When it comes to renewable energy, the transition to alternative supply sources is established across the industry. The integration of climate-neutral raw materials in production is taking place, in particular by applying the mass balance approach. This consists of integrating alternative raw materials in the upstream stages of the value chain and of allocating the sustainable product attributes to specific end products along the value chain in accordance with internationally recognized, standardized processes. The mass balance approach makes it possible to integrate increasingly climate-neutral and circular raw materials into the existing asset structure. Our mass balance approach has already been certified by ISCC PLUS for several sites.
For fiscal 2024, we are not reporting any economic activities as taxonomy-aligned within the meaning of EU Regulation 2020/852 and the associated delegated acts. Many activities in our portfolio are not covered by the taxonomy at present, e.g., the manufacture of diisocyanates such as diphenylmethane diisocyanate, or MDI, toluylene diisocyanate, or TDI, which are required for processing into polyurethane. For this reason, only a small proportion of Covestro’s portfolio is potentially taxonomy-aligned. It is therefore not practicable to make any statement as to whether and to what extent the aforementioned planned investments and operating expenditures for achieving our GHG reduction targets will simultaneously result in an increase in the proportion of taxonomy-aligned activities.
Covestro purchases the energy required at most sites: electricity, steam, and cooling. A small number of sites produce their own energy on the basis of fossil fuels such as coal, oil, or gas. No significant investments were made in these facilities in fiscal 2024.
According to a self-assessment, Covestro AG fulfilled all requirements in principle to be included in the EU Paris-aligned Benchmarks (PABs) in fiscal 2024. In the reporting year, Covestro was neither involved in activities that would require exclusion, nor were relevant sales above the defined thresholds generated by activities that would require exclusion. The review was performed on the basis of the exclusion criteria in accordance with Article 12 of Delegated Regulation (EU) 2020/1818 (minimum standards for EU Climate Transition Benchmarks and EU Paris-aligned Benchmarks). Moreover, Covestro was not informed of any exclusion from PABs.
Our alignment with climate neutrality and the circular economy is a core element of our corporate strategy. Other elements are our ambitious reduction targets for emissions from our own production facilities and from purchased energy sources, as well as for emissions from upstream and downstream value chains. The associated investment required, the savings potential, and additional operating costs are included in the regular internal planning processes.
The targets and actions for achieving net-zero emissions were approved by the Board of Management and presented to the Supervisory Board.
Since the publication of our Scope 1 and Scope 2 targets in 2022, the actions for achieving net-zero emissions were defined in our CO2 roadmap; progress is assessed and reported regularly to the Board of Management. Different software solutions are used to assess the impact of investments on GHG emissions. The CO2 roadmap is reviewed annually, updated, and discussed with the Chief Technology Officer.
Since the announcement of the Scope 3 targets at the start of 2024, implementation bodies have been established to operationalize the transitional plans in consultation with the various corporate functions. These bodies, consisting of managerial employees from the Group Innovation & Sustainability, Process Technology, Group Procurement, Controlling, Group Health, Safety, Environment and Reliability, and Strategy functions as well as from the business entities, discuss and allocate resources for the implementation of our transition plan.
Further information and examples of individual actions on the level of the different reduction levers can be found in the “Policies and Actions” section. Details of our GHG emissions in the reporting year and in the previous year can be found in the “Metrics” section.
Resilience Analysis
Between August and September 2024, Covestro conducted a physical climate risk analysis for 47 sites, in which 11 potentially material physical risks were identified for the years 2030, 2040, and 2050 on the basis of the SSP5-8.5 scenario: heat stress, water stress, sea level rise, heatwave, tornado, tropical cyclone, storm, drought, flood, heavy precipitation, and subsidence.
A questionnaire is used as part of the resilience analysis in order to assess existing measures at each site that are suitable to adapt to the identified hazards.
The construction and organizational measures identified are suitable for mitigating the chronic and acute risks. For the risks of heat stress, water stress, sea level rise, tropical cyclone, storm, flood, subsidence, and heat wave, we are planning and assessing further measures in order to keep the risk to a minimum.
Based on what we know today, we have not identified any negative impacts on Covestro’s business model.
Given the nature of the scenario-based analysis, uncertainty remains as to the specific magnitude of each of the hazards per site. Continuous monitoring of the physical risks and of the appropriateness of the associated adaptation measures ensures that additional measures can be implemented if new information comes to light.
Policies and Actions
The material impacts identified are addressed globally under our corporate Health, Safety, Environment and Energy, and Quality (HSEQ) policy. The basic principles it contains are published in the Policy Booklet on our website.
For the material impacts in the areas of climate change mitigation and energy, the global corporate policy is operationalized by our CO2 roadmap and our integrated HSEQ management system. The CO2 roadmap forms the basis for prioritizing specific GHG reduction actions and will fundamentally be used to address and analyze direct and indirect sources of emissions in accordance with the Greenhouse Gas Protocol (GHG Protocol). Prioritization on the global level is based on GHG avoidance costs, both for our own investments and for the procurement of renewable or climate-neutral energy and alternative raw materials.
Actions to reduce emissions are identified in close collaboration between our sites, the relevant corporate functions, such as Group Innovation & Sustainability, Group Procurement, and Logistics, and the business entities. Their joint task lies in developing and implementing new and more sustainable process technologies, energy efficiency projects, and procurement strategies. This also includes internal and external positioning in respect of relevant actions to achieve the climate neutrality targets, such as carbon capture and storage (CCS), carbon capture and usage (CCU), mass balancing, and carbon compensation. Following central prioritization by the implementation bodies, selected technical actions and procurement measures are considered in the annual resource and allocation planning that is approved by the Board of Management.
Further information and details on the integrated HSEQ management system can be found in ESRS E2 Pollution.
Although the climate risk analysis identified a material gross risk in connection with the sustainability matter of climate change adaptation, we do not see any need to develop Group-wide policies or actions that require the use of significant resources. Individual actions for selected sites are assessed on the basis of the resilience analysis.
Actions for Reaching the Scope 1 and Scope 2 Net-Zero Target
The three levers for achieving our reduction target and our progress in attaining our target are presented in detail below.
1 Including compensation actions in the areas of activity to offset any residual emissions.
2 Achievement of net-zero GHG emissions is defined as a balance between anthropogenic production of GHG emissions (caused by the company’s own production activities and by the provision and use of energy produced outside the company) and anthropogenic reduction of GHG emissions.
More Sustainable Production Processes
We invest continuously in expanding existing production capacities and building new capacities. In doing so, we undertake to use state-of-the-art, climate-friendly technologies for more sustainable production processes. The focus here is both on reducing energy consumption through increased efficiency and on cutting process emissions during production. The projects of our long-term investment planning have already been included in formulating our climate targets and the associated CO2 roadmap. In the reporting year, we implemented two projects at the Baytown (Texas, United States) and Shanghai (China) sites to reduce nitrogen oxide emissions. The installation of plant units with improved catalysts makes it possible to achieve a significant reduction of around 160,000 metric tons of CO2 equivalents each year from 2025. Overall, we invested €33 million in actions connected with the CO2 roadmap in the reporting year. This is equivalent to 3.8% of the investments in property, plant, and equipment in the fiscal year. Of this amount, €6 million was attributable to taxonomy-eligible economic activities. The CO2 roadmap addresses a significantly broader range of our economic activities than are currently covered by the Taxonomy Regulation.
Electricity from Renewable Sources
In addition to more efficient energy usage in our production processes, the transition to renewable energy is an important lever on the road to climate neutrality. In the future, Covestro therefore intends to meet all of its energy needs with renewable energy. Actions we have taken toward this goal include developing new supply plans and signing purchase contracts for renewable energy, particularly electricity. To further drive the shift toward more sustainable sources of energy (in relation to Scope 2 emissions), we will above all apply innovative collaborative models and technologies.
In the reporting year, in addition to the existing agreements for the purchase of electricity from renewable sources in Belgium, China, and Germany, we concluded further agreements worldwide, e.g., for our sites in the United States and in Tarragona (Spain). In this process, Covestro made use of special power purchase agreements and power certificates (e.g., Guarantees of Origin in Europe). This is intended to contribute to shrinking the carbon footprint in production, in our products, and in our customers’ applications.
Climate-Neutral Steam
We continue to evaluate options for using biogenic and renewable sources of energy, such as hydrogen and hydrogen derivatives or direct electrification, as well as the use of carbon capture technologies to supply climate-neutral process heat to our sites. These technologies for providing climate-neutral steam can contribute substantially to reducing GHG emissions in the future, e.g., by using hydrogen and its derivatives for generating energy and as a production input in CO2 conversion in the chemical industry.
For the first time, Covestro is investing in an innovative heat battery at the Brunsbüttel (Germany) site. The Rondo Heat Battery stores intermittent renewable electricity and delivers continuous high-temperature steam – thus offering a sustainable alternative to steam generation with fossil fuels. The RHB100 heat battery is scheduled to begin operation at the end of 2026. It will then produce 10% of the steam required at the site, saving up to 13,000 metric tons of CO2 emissions per year.
In the fiscal year, no significant operating expenditures (OpEx) were made in relation to the above actions. Likewise, no significant OpEx is planned for these actions in future fiscal years. Further details about planned expenditures can be found in “Our Transition Plan for Climate Change Mitigation.”
Actions for Reaching the Scope 3 Net-Zero Target
The four levers for achieving our reduction target are presented in detail below.
1 Due to rounding, the volumes of the four action areas do not add up to exactly 10.0 million metric tons of CO2 equivalents.
Reduction of Suppliers’ Scope 1 and Scope 2 Emissions
Many of Covestro’s raw material suppliers have already defined their own Scope 1 and Scope 2 targets, which could contribute in turn to Covestro’s Scope 3 targets. To reduce the Scope 1 and Scope 2 emissions of suppliers, Covestro maintains an active dialogue with its suppliers, e.g., in the context of a Scope 3 supplier event organized in the reporting year. A further example is the long-term supply agreement for chemically recycled raw materials concluded in 2024 by Covestro and Encina Development Group LLC, The Woodlands, Texas (United States). It covers the supply of raw materials recovered from used plastics, thereby reducing Covestro’s Scope 3 emissions. Other key short-term action areas include electrification, improved efficiency, and CCS in suppliers’ manufacturing processes.
Sale of Products Based on Alternative Raw Materials
With its CQ (Circular Intelligence) label, Covestro already has circular solutions in its product portfolio that contribute to the sale of products based on alternative raw materials. CQ products contain at least 25% alternative, nonfossil raw materials.
MAKE Projects
MAKE projects are our own investments in the development of more sustainable process technologies. These include, e.g., the production of biobased aniline or the use of our own recycling technologies to enable the use of recycled raw materials. Another example of a MAKE project is Covestro’s Evocycle CQ technology, which is used to recycle mattresses. Overall, we invested €4 million in MAKE projects in the reporting year, which accounted for 0.4% of investments in property, plant, and equipment in the fiscal year. Of this amount, €1 million was attributable to taxonomy-eligible economic activities.
Further Actions
The further actions include, e.g., increasing recycling rates to reduce emissions from waste incineration, changes in logistics processes such as the use of electric trucks, and changes in primary energy generation. In addition, innovation processes are to be accelerated by means of digital research and development and artificial intelligence.
The Scope 3 targets are based on the levers described above and their contributions (see chart). In the coming fiscal year, we plan to be able to assess our progress in attaining our targets at the lever level. The latest metrics on our Scope 3 emissions are presented in “GHG Emissions.”
No significant operating expenditure (OpEx) was made in fiscal 2024 to reduce Scope 1 and Scope 2 emissions of suppliers or in connection with the sale of products based on alternative raw materials and other actions. Likewise, no significant OpEx is planned for the above actions in future fiscal years. Further details about planned expenditures can be found in “Our Transition Plan for Climate Change Mitigation.”
Targets
Climate Change Adaptation
In connection with the sustainability matter of climate change adaptation, Covestro has not set itself a Group-wide target within the meaning of the ESRSs at this stage, as no material negative impacts on the business model are expected.
Climate Change Mitigation
Absolute reduction targets were published in fiscal 2022 for reducing our Scope 1 and Scope 2 emissions at all environmentally relevant sites. In 2023, an absolute reduction target for Scope 3 GHG emissions was also set.
In terms of potential residual emissions in the future, i.e., those that are technically unavoidable, the use of technical and natural CO2 sinks, or compensation actions to potentially balance all GHG emissions (Scope 1, Scope 2, and Scope 3) are currently being evaluated.
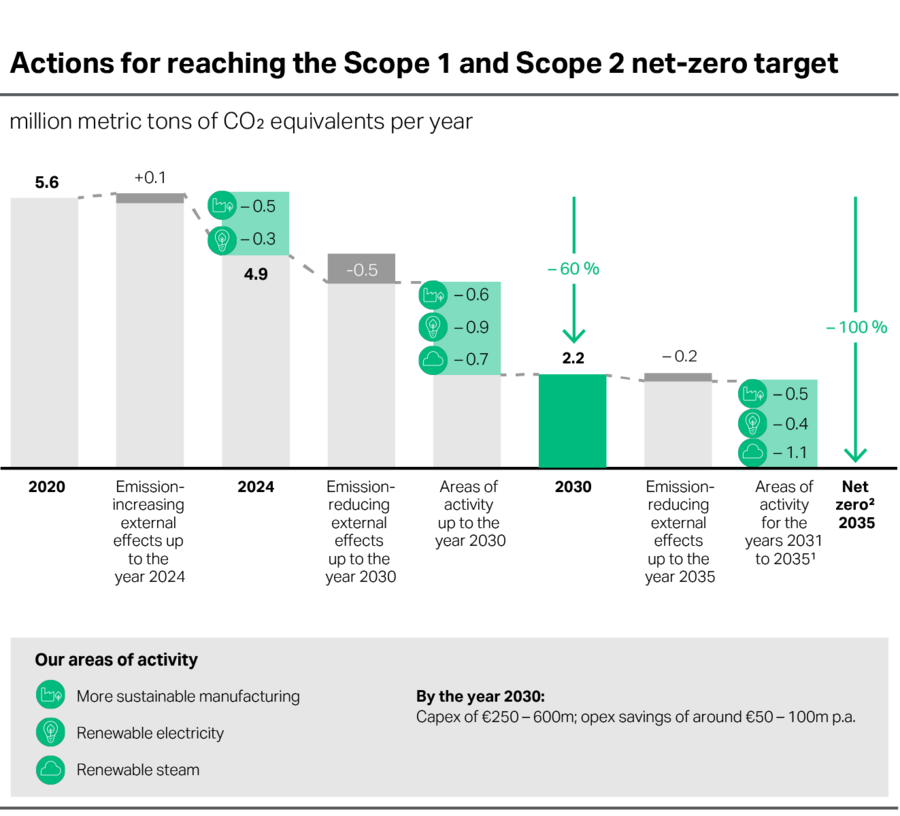
In the baseline year of 2020, Scope 1 emissions accounted for 22% and (market-based) Scope 2 emissions for 78% of the combined Scope 1 and Scope 2 emissions. Fiscal 2020 was chosen as the base year because the emissions represented the mean for the last three years before the targets were defined and published in the year 2022. In the reporting year, the ratio was 21% Scope 1 emissions to 79% Scope 2 emissions. Net-zero Scope 1 and Scope 2 GHG emissions are to be attained at all environmentally relevant sites by the year 2035. We are currently assuming that residual emissions of 0.3 to 0.5 million metric tons of CO2 equivalents could remain in the year 2035. This means that our net-zero target for the year 2035 corresponds to a reduction in gross emissions by 91.1% to 94.6% compared with the baseline year of 2020. On the way to meeting this target, the company plans to reduce direct and indirect GHG emissions of 5.6 million metric tons of CO2 equivalents in the baseline year of 2020 by 60% to 2.2 million metric tons of CO2 equivalents by the year 2030 (excluding compensation actions). Since Covestro has not set any annual targets, the reduction percentages should be read as averages over a ten-year period.
Covestro pursues a growth strategy, although this is not expected to have a significant impact on our annual Scope 1 and Scope 2 GHG emissions through the year 2035. External factors that are having a beneficial effect on our climate neutrality are expected to make an annual contribution of 0.7 million metric tons of CO2 equivalents by the year 2035. This includes, for example, Germany’s target to reach a renewable energy share of 80% in the German power mix by the year 2030 and Germany’s plans to phase out coal.
The implementation of sustainable production processes as the first action area is expected to contribute to a reduction of 1.1 million metric tons of CO2 equivalents in future, while the transition to electricity from renewable sources – the second action area – should enable savings of 1.3 million metric tons of CO2 equivalents. As for the third action area – climate-neutral steam – a reduction in emissions by 1.8 million metric tons of CO2 equivalents is to be achieved by changing the supply of process heat.
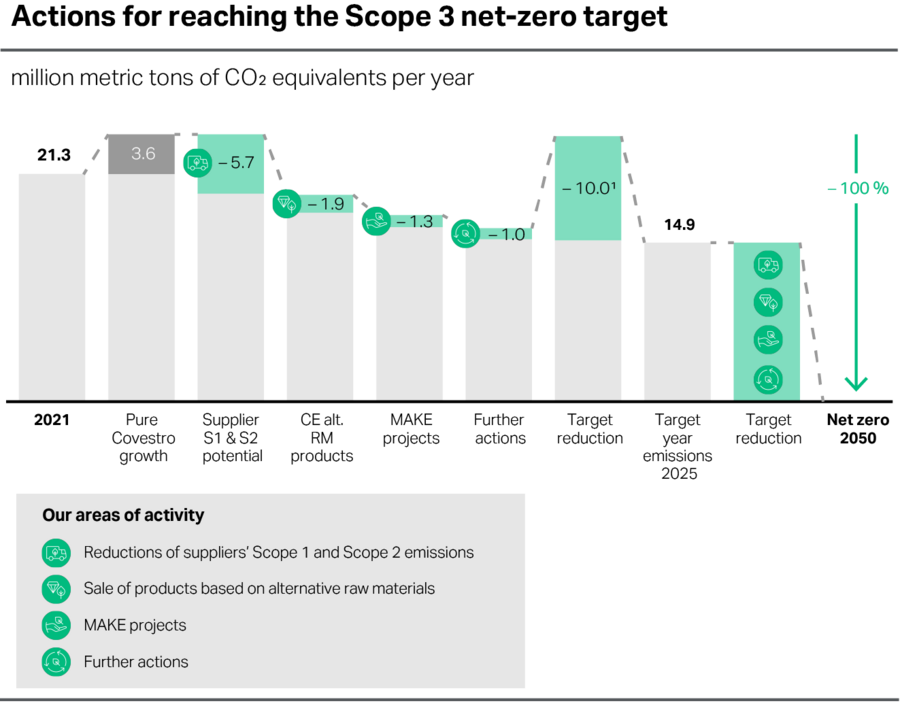
In the base year of 2021, Scope 3 emissions accounted for 80% of Covestro’s total emissions. This figure was 79% in the reporting year. Fiscal 2021 was chosen as the base year because Scope 3 emissions were recorded and reported from that year onward. Net-zero Scope 3 GHG emissions are to be attained by the year 2050. We are currently assuming that residual emissions of 5% to 10% could remain in the year 2050. On the way to meeting this target, the company plans, by the year 2035, to reduce GHG emissions from upstream and downstream processes in the value chain by 10 million metric tons of CO2 equivalents (equivalent to 30%) compared with the baseline year of 2021* (excluding compensation actions). The four relevant categories, “Purchased goods and services,” “Fuel- and energy-related activities,” “Upstream transportation and distribution,” and “End-of-life treatment of sold products,” are considered in our Scope 3 reduction targets.
Covestro pursues a growth strategy, and we therefore assume that our annual Scope 3 GHG emissions will gradually increase by 3.6 million metric tons of CO2 equivalents by the year 2035.
The reduction of suppliers’ Scope 1 and Scope 2 emissions as the first action area is expected to contribute to a reduction of 5.7 million metric tons of CO2 equivalents, while the sale of products based on alternative raw materials – the second action area – should enable savings of 1.9 million metric tons of CO2 equivalents. As for the third action area – MAKE projects – a reduction in emissions by 1.3 million metric tons of CO2 equivalents is to be achieved by our own investment in, e.g., recycling technologies. Further reductions, e.g., in logistics or primary energy generation, are expected to amount to 1.0 million metric tons of CO2 equivalents.
Until the year 2030, we will focus closely on the Scope 1 and Scope 2 targets that we can influence directly. Attainment of our Scope 3 targets is based on both upstream and downstream dependencies in the value chain; that is why the year 2035 was chosen for the interim Scope 3 reduction target. By 2030, we anticipate more clarity about the timing of implementation, regulatory trends, and technological developments.
The Scope 1 and Scope 2 targets were developed using the methodology of the Science Based Targets initiative (SBTi) and exceed its requirements. We are aiming for a reduction of 60%, while the Science Based Targets initiative specifies 42% by the year 2030. The Science Based Targets initiative provides companies with a clearly defined, science-based pathway to reducing emissions in line with the goals of the Paris Agreement. The targets of the Science Based Targets initiative continue to be accepted and are considered “science-based” for being able to meet the targets of the Paris Agreement: to limit global warming to 1.5°C above pre-industrial levels. These targets are subject to inherent uncertainty in relation to more recent scientific findings and methods.
Progress in implementing our CO2 roadmap and reducing our Scope 1 and Scope 2 emissions indicates that we will be able to attain the targets we have set for our company.
In principle, the long-term Scope 3 reduction target to be met by the year 2050 is also in line with requirements of the Science Based Targets initiative to achieve net-zero emissions by the year 2050 at the latest and aimed at limiting global warming to 1.5°C.
The Science Based Targets initiative is in the process of developing industry-specific reduction pathways. Since no reduction pathways or interim targets have been published yet for the chemical industry, it is not possible at present to assess the Scope 3 interim target for the year 2035 in accordance with the Science Based Targets initiative framework. Our interim target for the year 2035 does not correspond to the cross-sector Science Based Targets initiative-framework.
Our climate targets have not been certified by the Science Based Targets initiative at this stage.
By aligning ourselves with international and European ambitions to limit global warming to 1.5°C, we have indirectly taken the expectations of affected stakeholders, such as local communities, persons in vulnerable situations, and nature, into account.
The Scope 1 and Scope 2 emissions of Covestro’s main sites have been integrated into our management system. From fiscal 2025, it will also include the Scope 1 and Scope 2 emissions of all Covestro’s environmentally relevant sites.
By using a structured process, we guarantee continuous monitoring of our progress, a prompt response to changes, and the goal-oriented management of our efforts to reduce Scope 1 and Scope 2 emissions. Firstly, we evaluate changes in our Scope 1 and Scope 2 GHG emissions for the current fiscal year on a quarterly basis. Secondly, as part of our strategic planning cycle, we prepare a detailed annual forecast up to the year 2035. If there are significant variances between forecast and targets, we review and adjust our policies and actions for reducing emissions.
We are at the same time working on a similar process for our Scope 3 emissions.
When setting reduction targets, assumptions were made as to future developments and their influence on our emissions and reduction options. Both the effects of the company’s own business growth and external effects, such as regulatory changes and the development of Germany’s energy mix, were included in this process.
We are seeing a fundamental transition toward sustainable business practices in Covestro’s core markets. This transition is resulting in changing product requirements such as lower weight, better insulating properties, a reduced carbon footprint, recyclability, and a higher recycled material content. In concrete terms, the transition is generating a positive change in the demand for materials from our main customer industries. Looking ahead, for example, more lightweight materials like those produced by Covestro will be needed in the mobility and transport areas to facilitate energy-efficient electromobility. In the construction sector, it is insulating materials that will (help) enable the transition to climate-neutral buildings. Therefore, our customers’ efforts to achieve climate neutrality in the core markets surveyed are the drivers of greater demand for our products, including those from our fossil-based portfolio.
We assume that the pace of decline in Scope 3 emissions will increase from the year 2030 because the technological innovations for industrial-scale applications are still at the early stage of development and will not be available until the end of the decade. We also expect regulatory trends to drive the demand for alternative solutions from the year 2030, thus resulting in emission reductions.
Energy
For an energy-intensive company like ours, the reduction in the amount of energy we use plays a key role in efforts to reduce our Scope 1 and Scope 2 emissions. Covestro’s energy usage includes the primary energy used in production and during self-generation of electricity and steam as well as additionally acquired quantities of electricity, steam, cooling, and process heat (secondary energy).
In the reporting year, in order to align our energy usage more closely with our Scope 1 and Scope 2 reduction targets, we introduced a new energy efficiency target in place of the previous one. By the year 2030, we aim to improve our energy efficiency (total energy usage in MWh in relation to our production volume in metric tons) at all environmentally relevant sites by 20% compared with 2020 levels. Unlike the energy target pursued previously, the parameters now correspond to those of the climate neutrality target (same base year and scope of relevant sites). Due to the time horizon for this target, we see no need to define an interim target. As this target is a sub-target of the Scope 1 and Scope 2 reduction targets, stakeholder engagement has been implemented accordingly in connection with this target. Actions are covered by the “More Sustainable Production Processes” section and also contribute to our target of improving our energy efficiency. We will assess progress toward target attainment at least once a year.
Our energy efficiency amounted to 0,97 MWh per metric ton in the base year of 2020. We have achieved an improvement of 12.8% since then.
Metrics
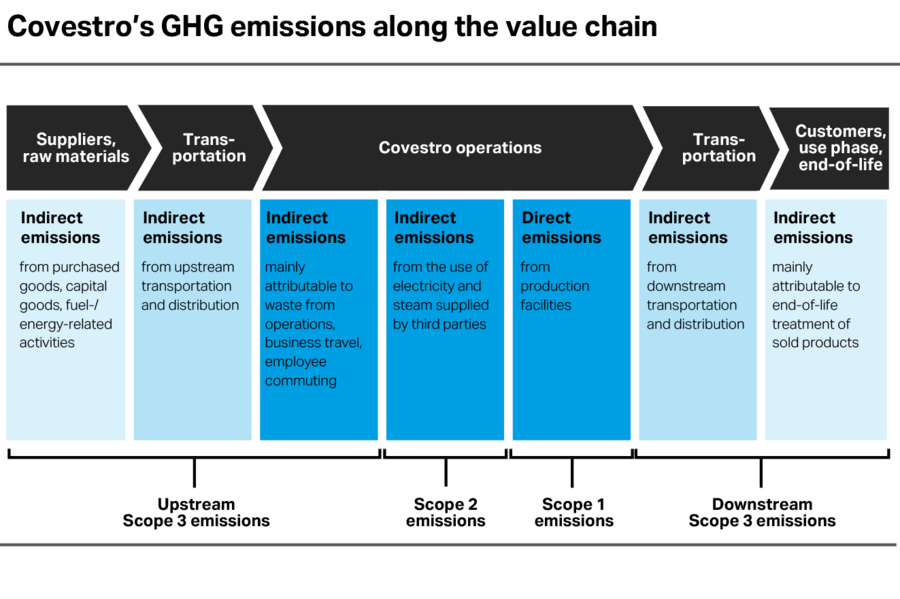
{Greenhouse Gas Emissions
The reporting of direct GHG emissions, e.g., from burning fossil energy sources and from our production processes (Scope 1), of indirect GHG emissions from the provision and use of energy produced outside the company (Scope 2), and of GHG emissions from upstream and downstream processes in the value chain (Scope 3), is based on the requirements of the GHG Protocol Corporate Standard (2004 version) as well as the GHG Protocol Scope 2 Guidance (2015 version) and the Guidance for Accounting & Reporting Corporate GHG Emissions in the Chemical Sector Value Chain (2013 version).
In addition to CO2, the inventory of Scope 1 emissions comprises all relevant GHGs, including nitrous oxide (N2O), methane (CH4), partly fluorinated hydrocarbons, sulfur hexafluoride (SF6), and nitrogen trifluoride (NF3). Where available, our sites use local emission factors that are as precise as possible. If these are not known, we use the standard factors provided by Germany’s Federal Environment Agency. All Scope 1 emissions are disclosed as CO2 equivalents using the global warming potential (GWP) factors. The relevant factors are those from the IPCC’s Sixth Assessment Report. Scope 1 emissions comprise stationary, mobile, process-related, and fugitive sources of emissions. At present, the Group does not generate any significant biogenic emissions. If this were to change, we will report these quantities separately in the future.
If, in our efforts to achieve climate neutrality, compensation actions are taken in relation to our Scope 1 and Scope 2 GHG emissions, they are disclosed in accordance with the GHG Protocol. We currently sell carbon certificates to third parties and, in accordance with the GHG Protocol, do not use these volumes as offsets.
In fiscal 2024, the Covestro Group did not implement any projects to reduce and/or store greenhouse gases within its own operating activities. Moreover, it did not contribute to any such projects in the upstream and downstream value chain, and no climate change mitigation projects outside the company’s own value chain were financed by the purchase of carbon credits.
In our greenhouse gas balance, we report GHG emissions from facilities and sites that are subject to emissions trading. Most of these facilities are in Europe and are subject to German or European emissions trading. Some of the trading systems cover methane as well as CO2. Due to the very small amounts of relevant methane emissions (around 0.1% of the Group’s Scope 1 emissions), the indicator only covers CO2 emissions. As there are different disclosure dates and methodologies for the Group Sustainability Statement and the individual emissions trading systems, this may result in slight deviations at site level which are negligible at Group level.
Scope 2 emissions are reported using the location-based and market-based methods. Location-based emissions factors from generally accepted sources (e.g., International Energy Agency** emissions factors) were used when calculating location-based Scope 2 GHG emissions. Market-based emissions factors were used when calculating market-based Scope 2 GHG emissions; where these were not available, location-based emissions factors were used. For Covestro, the market-based method is the leading calculation method for Scope 2 GHG emissions. Market-based instruments are used at almost all major production sites; they may include specific purchasing contracts for electricity from renewable sources or separately purchased certificates (e.g., Guarantees of Origin). Moreover, some smaller production sites already purchase up to 100% of their electricity from renewable sources. In the reporting year, the proportion of all contractual instruments with “green” attributes in total energy usage was 7%.
At present, we have no information concerning any significant biogenic emissions by our suppliers. If this were to change, we will report these quantities separately in the future.
We record our Scope 1 and Scope 2 GHG emissions for all consolidated companies. All nonconsolidated companies in the scope of consolidation were examined to determine whether Covestro has operational control as defined by ESRS. No emissions of associates, joint ventures, or non-consolidated subsidiaries under merely operational control have to be reported for Covestro on the basis of this examination. Joint arrangements, over which we have no operational control, are reported to reflect the rights and obligations of the Covestro Group, in the same way as in financial reporting. Since these metrics are calculated only at the end of the year, they include the group of companies consolidated as it stands at year-end. In this process, we incorporate data from all environmentally relevant Covestro sites, i.e., all production sites and relevant administrative sites. In order to meet the disclosure deadlines, the sites estimate the environmental data for the last weeks of the current fiscal year using established extrapolation methods (e.g., on the basis of operations planning, averages, or data from the prior-year months) to ensure that data reporting is as precise as possible and close to the actual values for the year. If, however, in the course of the following year, we become aware of material deviations based on internally defined thresholds, the figures in question are corrected retroactively. This was not required in fiscal 2024 for the preceding fiscal year 2023.
At Covestro, upstream and downstream GHG emissions data along the value chain (Scope 3 emissions) is determined for all sites and business activities that indirectly cause relevant GHG emissions according to the categories and methods of the GHG Protocol and the Guidance for Accounting & Reporting Corporate GHG Emissions in the Chemical Sector Value Chain by the World Business Council for Sustainable Development (WBCSD). Accordingly, all categories as defined in the GHG Protocol were reviewed for relevance in order to quantify all emissions associated with Covestro’s business activities as completely as possible. Out of the total of 15 categories, nine are relevant for Covestro and we report the appropriate emission values for them. The basis for calculating the other indirect GHG emissions (Scope 3) are internal activity data and emission factors.
The six main categories reported separately in the “Metrics” section cover 99.7% (previous year: 99.7%) of our Scope 3 emissions. The activity data used for these categories is based exclusively on actual operating data collected through standardized processes with system support. The emission factors used for these categories are based exclusively on commercially and publicly available sources, or sources recommended by the GHG Protocol. For the “End-of-life treatment of sold products” category, we use the results of an external study on the global plastics flows, including the treatment of post-consumer plastics waste for the breakdown of end-of-life treatment methods for each region in which we distribute our products (Conversio Study 2018***). In this context, we assume that the products are used and disposed of in the countries to which they were sold. The breakdown of waste treatment derived from the Conversio Study 2018 is assumed to be stable until a more reliable or more specific source of information on (plastics) waste is available for Covestro products.The individual calculations of the emissions for each Scope 3 category are described in detail in our latest Carbon Disclosure Project (CDP) questionnaire, which is publicly available.
The share of total emissions determined directly with primary supplier data is 34%.
By continuously improving the data basis and calculation methods used, we will further advance the accuracy of our Scope 3 emissions reporting on an ongoing basis.
Scope 1 and Scope 2 emissions declined by 5% in total in the reporting year. Scope 1 emissions rose by 9% for reasons such as the increase in production and the associated energy demand, while Scope 2 emissions went down 8%. The main drivers of the reduction were primarily emission factors at our largest sites in Germany and in Baytown, Texas (United States).
Scope 3 emissions rose in the year 2023 in almost all subcategories reported. The main drivers are an increase in the volumes purchased and sold, as well as higher emission factors, which are primarily attributable to a methodology update of the databases used for emission factors.
| GHG emissions (million metric tons of CO2equivalents)1, 2 | |||||||||
|---|---|---|---|---|---|---|---|---|---|
| Retrospective | Milestones and target years | ||||||||
| Base year3 | 2023 | 2024 | Change | 2030 | 2035 | 2050 | Annual % target/base year | ||
| Scope 1 GHG emissions | |||||||||
| Gross Scope 1 GHG emissions | 1.25 | 0.93 | 1.014 | 9% | |||||
| Percentage of Scope 1 GHG emissions from regulated emission trading schemes5 | 49.6 | ||||||||
| Scope 2 GHG emissions6 | |||||||||
| Gross location-based Scope 2 GHG emissions | 4.48 | 4.10 | 4.32 | 5% | |||||
| Gross market-based Scope 2 GHG emissions | 4.33 | 4.18 | 3.84 | –8% | |||||
| Scope 1 and 2 GHG emissions (market-based) | 5.58 | 5.11 | 4.85 | –5% | 2.2 | 0,3–0,5 | 6% | ||
| Significant Scope 3 GHG emissions6, 7 | |||||||||
| Gross Scope 3 GHG emissions | 21.84 | 15.75 | 17.98 | 14% | |||||
| 1 Purchased goods and services | 16.44 | 11.86 | 13.57 | 14% | |||||
| 2 Capital goods | 0.34 | 0.52 | 0.29 | –44% | |||||
| 3 Fuel and energy-related activities | 1.02 | 0.81 | 1.05 | 30% | |||||
| 4 Upstream transportation and distribution | 0.49 | 0.52 | 0.59 | 13% | |||||
| 5 Waste generated in operations | 0.16 | 0.10 | 0.11 | 10% | |||||
| 12 End-of-life treatment of sold products | 3.34 | 1.89 | 2.33 | 23% | |||||
| Other categories | 0.05 | 0.05 | 0.06 | 20% | |||||
| Scope 3 target-relevant categories (3.1; 3.3; 3.4; 3.12) | 21.30 | 15.08 | 17.54 | 16% | 14.9 | 1.1–2.1 | 3% | ||
| Total gross GHG emissions | |||||||||
| Total location-based GHG emissions | 20.78 | 23.31 | 12% | ||||||
| Total market-based GHG emissions | 20.86 | 22.83 | 9% | ||||||
| Total net GHG emissions | |||||||||
| Sold compensation actions | 0.65 | 0.568 | –14% | ||||||
| Total market-based GHG emissions including compensation actions | 21.51 | 23.39 | 9% | ||||||
| GHG intensity9 (million metric tons of CO2 equivalents, location-based/€ million) | 0.0014 | 0.0016 | 14% | ||||||
| GHG intensity9 (million metric tons of CO2 equivalents, market-based/€ million) | 0.0015 | 0.0016 | 11% | ||||||
1 Scope 1, Scope 2, and Scope 3 GHG emissions determined as set out in the GHG Protocol; global warming potential (GWP) factors according to the IPCC’s Sixth Assessment Report.
2 Since the external auditor did not review the Scope 3 emissions with reasonable assurance in the base year, these figures and figures calculated using them as a basis were reviewed only with limited assurance.
3 Base years: fiscal 2020 for Scope 1 and Scope 2 emissions; fiscal 2021 for Scope 3 emissions.
4 In the year 2024, 79.4% of emissions were CO2 emissions, 20.1% were N2O emissions, 0.4% consisted of partly fluorinated hydrocarbons, 0.1% were attributable to CH4 and less than 0.1% to SF6.
5 At the date of publication, the authorities had not yet verified the ETS volumes for the 2024 reporting year. The percentage of Scope 1 GHG emissions from regulated emissions trading systems has only been determined since the 2024 reporting year. No comparative prior-year value is available.
6 As a rule, CO2 accounts for more than 99% of all GHG emissions from incineration processes. For this reason, we limit our calculation of indirect emissions to CO2.
7 Non relevant emissions categories: 8 “Upstream leased assets”; 11 “Use of sold products”; 15 “Investments.” Estimates indicate that these categories account for <1% of Covestro’s total Scope 3 emissions. Their levels are therefore insignificant according to the definition in the GHG Protocol.
Nonapplicable emissions categories: 13 “Downstream leased assets”; 14 “Franchises.” Covestro does not operate any plants that are leased to third parties and whose emissions are not already included in Scope 1 and Scope 2 emissions reporting. Moreover, Covestro does not own or operate any franchises.
Unreported emissions category: 10 “Processing of sold products.” Since data could not always be obtained and there are numerous applications for Covestro’s products, calculating these emissions would require disproportionate effort. In this case, Covestro refers to the WBCSD guidance, according to which a chemical company whose product portfolio contains a broad range of intermediates is not required to report Scope 3, category 10 “Processing of sold products.”
The calculation of emissions categories 2 “Capital goods” and 1 “Purchased goods and services,” in relation to the share that is not attributable to raw materials, is based on spend-based emission factors of the Department for Environment, Food & Rural Affairs (DEFRA) from the year 2021, which have been updated using inflation rates according to the German consumer price index.
“Other categories” includes the following: 6 “Business travel,” 7 “Employee commuting,” 9 “Downstream transportation and distribution.”
8 Since certification of the reductions from October to December 2024 has not yet been completed, the expected reduction volumes are presented here. The plan is to sell the emission reductions made in the fiscal year as emission credits once they have been certified.
9 Ratio of total gross GHG emissions to the Sales line in the income statement in the Covestro Group consolidated financial statements..
Biogenic CO2 emission equivalents stemming indirectly from the value chain totaled 54,306 metric tons of CO2 equivalents (previous year: 73,605 metric tons of CO2 equivalents) in the reporting period in absolute terms and are disclosed separately from the total volume of Scope 3 emissions in accordance with the GHG Protocol and the WBCSD.
Energy Usage
We record energy volumes using the same method as for GHG emissions, i.e., we capture our data at all environmentally relevant sites. This includes both primary energy usage (e.g., natural gas) for production and our own energy generation and secondary energy usage from purchased electricity, steam, and cooling. Moreover, we record energy from renewable sources separately and only report energy volumes from renewable sources that have been specifically assigned to Covestro through contractual instruments (e.g., specific energy purchase agreements or Guarantees of Origin). If the “renewable energy” attribute cannot be reliably proven (e.g., on the basis of Guarantees of Origin), these volumes are recorded as non-renewable energy. If a utility mix also includes a proportion of renewable energy, this is currently not explicitly reported.
Where necessary, our sites use local emission factors that are as accurate as possible for conversion into units of energy. If these factors are not known, the standard values from the German Federal Ministry for Economic Affairs and Energy are used.
Due to the manufacture of chemical products, Covestro belongs to a group of companies attributed to the high climate impact sectors, and this requires us to make detailed disclosures on our fossil fuel consumption. According to Annex 2 of the ESRS, climate-sensitive sectors are: sectors that are listed in Sections A to H and Section L of Annex I to Regulation (EC) No 1893/2006 of the European Parliament and of the Council (15) (as defined in Commission Delegated Regulation (EU) 2022/1288). Detailed disclosures on energy consumption from fossil sources can be found in the table entitled “Energy consumption and energy mix.”
In addition, we measure our energy efficiency because we believe that energy usage is closely linked with our production volume. We calculate energy efficiency as the ratio of total energy usage to our production volume.
| Energy consumption and energy mix | ||
|---|---|---|
| 2023 | 2024 | |
| in MWh | in MWh | |
| Total fossil energy consumption | 13,246,000 | 14,069,000 |
| Share of fossil sources in total energy consumption | 93% | 92% |
| Coal | – | – |
| Liquid fuels | 70,000 | 71,000 |
| Natural gas | 2,453,000 | 2,747,000 |
| Other fossil sources | 131,000 | 93,000 |
| Secondary energy consumption from fossil sources | 10,592,000 | 11,158,000 |
| Total nuclear energy consumption1 | 189,000 | |
| Share of nuclear sources in total energy consumption | 1% | |
| Total renewable energy consumption | 1,018,000 | 1,008,000 |
| Share of renewable sources in total energy consumption | 7% | 7% |
| Fuel consumption for renewable sources | – | – |
| Secondary energy consumption from renewable sources | 1,017,000 | 1,008,0002 |
| Consumption of self-generated non-fuel renewable energy | 1,000 | – |
| Total energy consumption | 14,264,000 | 15,266,000 |
| Energy intensity3 (MWh/€ million) | 992.14 | 1,076.66 |
1 Calculation of the share of nuclear energy on the basis of statistical information of the Energy Institute (“2024 Energy Institute Statistical Review of World Energy”).
2 Due to the legal deadline set by Section 42 of the German Energy Industry Act (EnWG) for making an individual fuel mix disclosure, which occurs only after the preparation of the Annual Report 2024, the volumes (around 257,000 MWh) that have not yet been canceled at the time of preparing the Annual Report can only be duly canceled by the legal deadline at Germany’s Federal Environment Agency in the year 2025. This guarantees that, as a minimum, the total volume of electricity from renewable sources for North Rhine-Westphalia has been achieved.
3 Ratio of total energy consumption to sales in high climate impact sectors. As shown in the table, the energy intensity relating to activities in high impact climate sectors was calculated on the basis of Covestro Group sales. These are disclosed in the income statement and in note 6 “Sales” in the Notes to the Consolidated Financial Statements.
Covestro generates energy itself at many of its sites worldwide and, in most cases, uses this energy itself. In the reporting year, Covestro generated a total of 5,832,000 MWh of electricity and steam from nonrenewable sources. The amount of electricity and steam the company generated from renewable sources in the same period was around 300 MWh.}
Energy efficiency (energy usage as a ratio of production volume) is currently 0.85 MWh/metric ton. This equates to an improvement of 12.8% compared with the baseline year of 2020.
Internal CO2 Pricing
In order to meet the climate neutrality target, we assess our company’s (Scope 1 and Scope 2) GHG emissions and our investment projects as part of the investment project management process. We perform a sensitivity analysis on worldwide investments in excess of €5 million, in addition to calculating standard project ROCE (return on capital employed). We use two complementary policies to create incentives for CO2 reductions. For investment projects, we use a matrix to visualize the compromise between the financial impact (ROCE above WACC) and CO2 impact (CO2 equivalents per €1 million of investment) as well as a ROCE calculation, which applies an internal CO2 shadow price of €100 per metric ton of CO2 equivalent. A standard sensitivity analysis uses a CO2 shadow prices of €200 per metric ton of CO2 equivalents. The price range selected has been derived from the forecast by enervis energy advisors GmbH, taking account of existing and anticipated EU legislation, e.g., on emissions trading and on the Carbon Border Adjustment Mechanism (CBAM) until the year 2045. The internally applied CO2 shadow price is regularly reviewed and adjusted if necessary.
In the reporting year, the following volumes were measured at the CO2 shadow price: 105 kt of CO2 equivalents of Scope 1 emissions, 30 kt of CO2 equivalents of Scope 2 emissions, and 22 kt of CO2 equivalents of Scope 3 emissions. This corresponds to the following shares of total gross GHG emissions: 10.4% of Scope 1 emissions, 0.8% of Scope 2 emissions, and 0.1% of Scope 3 emissions.
The above-mentioned CO2 shadow prices are used exclusively in the context of managing investment projects. They are not used in the consolidated financial statements, neither when determining useful lives or for measuring the net carrying amounts of assets, nor for determining impairment losses on assets or measuring the fair values of assets acquired in business combinations.
Anticipated Financial Effects
ESRS E1 Climate change in principle also provides for qualitative and quantitative disclosures on anticipated financial effects from material physical and transition risks and potential climate-related opportunities. In accordance with ESRS 1 Appendix C, Covestro applies the phased-in disclosure requirements in the first year of preparing the Group Sustainability Statement. According to this expedient, the disclosures specified may be omitted in the first year.