Results of Operations and Financial Position of the Covestro Group
Results of Operations
Group sales declined by 12.0% in the third quarter of 2025, to €3,171 million (previous year: €3,603 million), driven mainly by a lower selling price level, which had a negative effect of 7.0% on sales. In addition, exchange rate movements had a sales-reducing effect of 3.5%. A decrease in volumes sold for reasons that included the production stoppage in Dormagen (Germany) had a decreasing impact on sales of 1.5%.
Sales were 16.6% lower, at €1,217 million (previous year: €1,460 million), in the EMLA region and declined by 7.3% to €829 million (previous year: €894 million) in the NA region in the third quarter of 2025. In the APAC region, sales dropped by 9.9% to €1,125 million (previous year: €1,249 million).
In the third quarter of 2025, sales decreased by 16.2% to €1,489 million (previous year: €1,777 million) in the Performance Materials segment and by 7.7% to €1,637 million (previous year: €1,773 million) in the Solutions & Specialties segment.
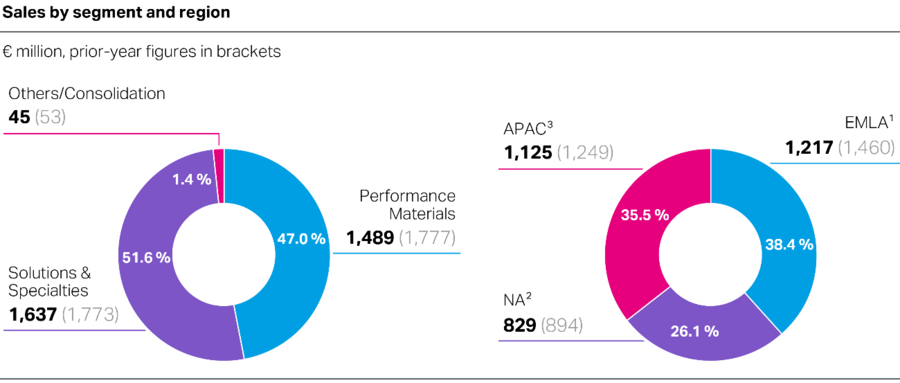
1 EMLA: Europe, Middle East, Latin America (excluding Mexico), Africa region.
2 NA: North America region (Canada, Mexico, United States).
3 APAC: Asia and Pacific region.
The Group’s EBITDA was down 15.7% to €242 million in the third quarter of 2025 (previous year: €287 million). The decline in the selling price level was only partially offset by lower raw material prices. The resulting drop in margins had a negative impact on earnings. Furthermore, the trend in volumes sold and exchange rate movements also had an adverse effect on earnings.
The expenses incurred to implement the transformation program STRONG had a negative impact on EBITDA in the low double-digit million euro range. Furthermore, a smaller amount of business development subsidies received in China than in the previous year had a negative effect on EBITDA.
Conversely, a gain on the sale of intangible assets of €20 million and the effect of an account entry of €11 million, which was recognized in income, in connection with the takeover of Pontacol AG, Schmitten FR (Switzerland), had a favorable impact on EBITDA.
The Performance Materials segment’s EBITDA rose by 39.2% to €174 million (previous year: €125 million). In the Solutions & Specialties segment, by contrast, EBITDA dropped by 5.8% to €196 million (previous year: €208 million).
The Covestro Group’s EBIT went down by 67.1% to €25 million in the third quarter of 2025 (previous year: €76 million).
Financial Position
In the third quarter of 2025, cash inflows from operating activities amounted to €302 million (previous year: €262 million). The rise in cash inflows was mainly attributable to higher funds freed up from working capital. In contrast, lower EBITDA had an adverse effect on cash flows from operating activities.
Free operating cash flow was largely stable in the third quarter of 2025, at €111 million (previous year: €112 million), with higher cash flows from operating activities almost fully offsetting the rise in cash outflows for additions to property, plant, equipment and intangible assets.
| Net financial debt | ||
|---|---|---|
| Dec. 31, 2024 | Sep. 30, 2025 | |
| € million | € million | |
| Bonds | 1,492 | 1,494 |
| Liabilities to banks | 870 | 1,284 |
| Lease liabilities | 736 | 674 |
| Liabilities from forward exchange contracts | 17 | 17 |
| Other financial debt | 41 | 181 |
| Receivables from forward exchange contracts | (6) | (18) |
| Gross financial debt | 3,150 | 3,632 |
| Cash and cash equivalents | (509) | (604) |
| Current financial assets | (23) | (17) |
| Net financial debt | 2,618 | 3,011 |
In comparison with December 31, 2024, the Covestro Group’s gross financial debt rose by €482 million to €3,632 million as of September 30, 2025. This was primarily attributable to an increase in liabilities to banks by €414 million, which resulted mostly from net borrowings of €448 million in China. Other financial debt rose at the same time, driven by the issuance of commercial paper of €404 million under the European Commercial Paper Program (ECPP); this was offset by a repayment of commercial paper of €264 million.
Cash and cash equivalents were up €95 million in comparison with the figure on December 31, 2024, to €604 million. This was mainly due to cash inflows from financing activities of €396 million and cash inflows from operating activities of €186 million. This was offset in particular by cash outflows for additions to property, plant, equipment and intangible assets of €556 million, which affected cash and cash equivalents.
The net cash inflows from short-term bank deposits drove down current financial assets by €6 million to €17 million.
Net financial debt therefore grew by €393 million compared with the figure on December 31, 2024, to €3,011 million as of September 30, 2025.