Results of Operations
Sales
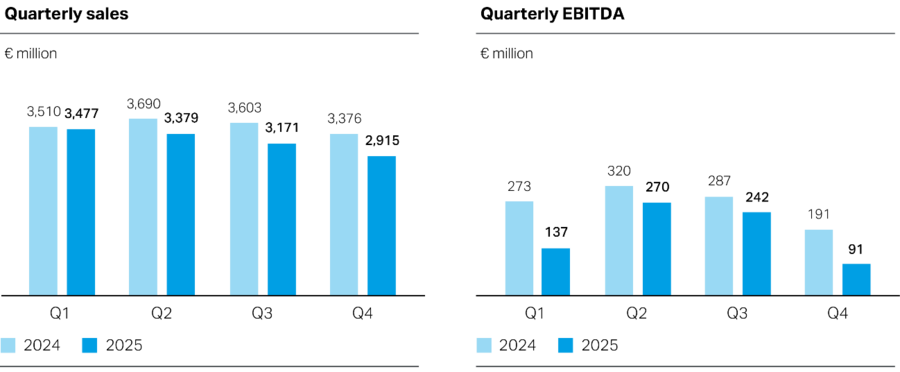
Group sales declined by 8.7% in fiscal 2025, to €12,942 million (previous year: €14,179 million). The decrease in sales was primarily attributable to a drop in the selling price level in all regions, which had a diminishing effect on sales of 5.2%. Furthermore, exchange rate movements had a decreasing effect on sales of 2.6%, while lower volumes sold also had an adverse impact of 0.9% on sales.
Sales in the Performance Materials segment were down 12.1% to €6,128 million in fiscal 2025 (previous year: €6,970 million). Sales in the Solutions & Specialties segment declined by 5.5% to €6,621 million (previous year: €7,004 million).
Sales were 11.4% lower, at €5,181 million (previous year: €5,848 million), in the EMLA region and 3.7% down, at €3,378 million (previous year: €3,507 million), in the NA region. Sales in the APAC region were down by 9.1% to €4,383 million (previous year: €4,824 million).
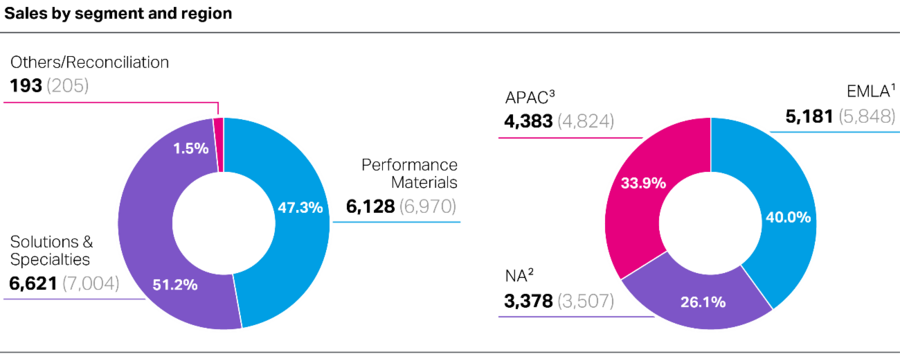
1 EMLA: Europe, Middle East, Latin America (excluding Mexico), Africa region.
2 NA: North America region (Canada, Mexico, United States).
3 APAC: Asia and Pacific region.
EBIT
| Summary consolidated income statement | |||
|---|---|---|---|
| 2024 | 2025 | Change | |
| € million | € million | % | |
| Sales | 14,179 | 12,942 | –8.7 |
| Cost of goods sold | (12,002) | (11,225) | –6.5 |
| Gross profit | 2,177 | 1,717 | –21.1 |
| Selling expenses | (1,513) | (1,455) | –3.8 |
| Research and development expenses | (392) | (342) | –12.8 |
| General administration expenses | (343) | (353) | 2.9 |
| Other operating expenses (–) and income (+) | 158 | 86 | –45.6 |
| EBIT | 87 | (347) | . |
| Financial result | (114) | (145) | 27.2 |
| Income before income taxes | (27) | (492) | . |
| Income taxes | (245) | (151) | –38.4 |
| Income after income taxes | (272) | (643) | 136.4 |
| attributable to noncontrolling interest | (6) | 1 | . |
| attributable to Covestro AG shareholders (net income) | (266) | (644) | 142.1 |
Cost of goods sold was down 6.5% to €11,225 million (previous year: €12,002 million), driven mainly by lower raw material costs. Energy costs, on the other hand, rose year-over-year, driven largely by government subsidies to compensate for electricity prices in Germany in an amount of €12 million, which was €43 million lower than in the previous year (€55 million).
The ratio of cost of goods sold to sales increased to 86.7% (previous year: 84.6%).
Gross profit fell 21.1% to €1,717 million (previous year: €2,177 million), primarily driven by a decline in the selling price level, which was only partially offset by the drop in raw material costs. In addition, negative effects from exchange rate movements reduced earnings. Conversely, changes in volumes sold had the effect of raising earnings, since the reduction in business with negative margins ultimately had a positive volume effect on EBITDA despite an overall decline in sales volumes.
Selling expenses were down 3.8% to €1,455 million (previous year: €1,513 million). The ratio of selling expenses to sales was 11.2% (previous year: 10.7%). Research and development (R&D) expenses declined by 12.8% to €342 million (previous year: €392 million). As a share of sales, this produced an R&D ratio of 2.6% (previous year: 2.8%). General administration expenses were up 2.9% to €353 million (previous year: €343 million), for a ratio of administration expenses to sales of 2.7% (previous year: 2.4%).
Other operating income exceeded other operating expenses by €86 million (previous year: €158 million). This amount included goodwill impairment losses of €42 million. In addition, EBIT was down year-on-year as a non-recurring positive effect from insurance compensation in the fourth quarter of 2024 had increased earnings by €55 million. This was offset by a higher gain of €19 million on the sale of intangible assets.
In the reporting year, the STRONG transformation program incurred expenses of €149 million for the implementation of the program, which were higher than in the previous year. This included expenses of €81 million, which affected EBITDA, in connection with the closure of the joint venture production site in Maasvlakte (Netherlands).
The force majeure declaration in Dormagen (Germany) had a negative effect on EBIT in the low triple-digit million euro range. On the other hand, lower provisions for short-term variable compensation in an amount of €108 million boosted EBIT.
EBIT declined to €–347 million (previous year: €87 million). The EBIT margin retreated to –2.7% (previous year: 0.6%).
EBITDA
| Calculation of EBITDA | ||
|---|---|---|
| 2024 | 2025 | |
| € million | € million | |
| EBIT | 87 | (347) |
| Depreciation, amortization, impairment losses, and impairment loss reversals | 984 | 1,087 |
| EBITDA | 1,071 | 740 |
Depreciation, amortization, impairment losses, and impairment loss reversals rose by 10.5% to €1,087 million in fiscal 2025 (previous year: €984 million), of which €974 million (previous year: €882 million) was attributable to property, plant and equipment and €113 million (previous year: €102 million) to intangible assets. A significant driver of this increase was a rise in impairment losses to €226 million (previous year: €142 million), of which €204 million (previous year: €106 million) was recognized as a result of central impairment tests. Impairment losses of €17 million (previous year: €59 million) were recognized in connection with the closure of the production site in Maasvlakte (Netherlands). As in the previous year, no impairment loss reversals were recognized.
For further information, please refer to note 13.3 “Impairment Testing” in the Notes to the Consolidated Financial Statements.
EBITDA decreased 30.9% year-over-year in the full-year period, declining to €740 million (previous year: €1,071 million). This was primarily attributable to the 34.1% drop in EBITDA, to €375 million (previous year: €569 million) in the Performance Materials segment. The Solutions & Specialties segment’s EBITDA declined by 8.0% to €681 million (previous year: €740 million).
Net Income
In the fiscal year, the financial result stood at €–145 million (previous year: €–114 million) and largely consisted of net interest expense of €97 million (previous year: €89 million). In view of the financial result, the loss before income taxes widened to €492 million (previous year: loss of €27 million). Income tax expense amounted to €151 million in the reporting year (previous year: €245 million). It includes impairment losses of €13 million (previous year: €46 million) on deferred tax assets arising from loss carryforwards and temporary differences. Furthermore, deferred tax assets arising from loss carryforwards and temporary differences of €232 million (previous year: €176 million) could not be recognized in the fiscal year. After income taxes and noncontrolling interests, the net loss amounted to €644 million (previous year: €266 million).
Return on Capital Employed (ROCE) above Weighted Average Cost of Capital (WACC)
| Calculation of the ROCE above WACC | |||
|---|---|---|---|
| 2024 | 2025 | ||
| EBIT | € million | 87 | (347) |
| Imputed tax rate | % | 25.0 | 25.0 |
| Imputed taxes1 | € million | 22 | (87) |
| Net operating profit after taxes (NOPAT) | € million | 65 | (260) |
| Average capital employed | € million | 9,370 | 9,102 |
| ROCE | % | 0.7 | –2.9 |
| Weighted average cost of capital (WACC) | % | 8.1 | 7.3 |
| ROCE above WACC | % points | –7.4 | –10.2 |
1 The imputed income taxes used in the calculation of NOPAT are determined by multiplying EBIT by the imputed tax rate.
The Covestro Group’s NOPAT totaled €–260 million (previous year: €65 million), and average capital employed amounted to €9,102 million (previous year: €9,370 million). The resulting ROCE was –2.9% (previous year: 0.7%), significantly lower than WACC of 7.3% (previous year: 8.1%).
Additional information on the calculation of indicators is available in “Management System.”
| Calculation of average capital employed | |||
|---|---|---|---|
| Dec. 31, 2023 | Dec. 31, 2024 | Dec. 31, 2025 | |
| € million | € million | € million | |
| Goodwill | 711 | 719 | 652 |
| Other intangible assets | 519 | 471 | 432 |
| Property, plant and equipment | 5,795 | 5,898 | 5,596 |
| Investments accounted for using the equity method | 182 | 269 | 235 |
| Other financial assets1 | 14 | 17 | 22 |
| Other receivables2 | 501 | 523 | 487 |
| Deferred tax assets3 | 248 | 209 | 284 |
| Inventories | 2,459 | 2,851 | 2,503 |
| Trade accounts receivable | 1,898 | 1,749 | 1,503 |
| Claims for income tax refunds | 102 | 92 | 67 |
| Assets held for sale4 | – | – | 8 |
| Gross capital employed | 12,429 | 12,798 | 11,789 |
| Other provisions5 | (548) | (599) | (632) |
| Other financial liabilities6 | (114) | (118) | (113) |
| Other nonfinancial liabilities7 | (228) | (247) | (220) |
| Deferred tax liabilities8 | (251) | (199) | (225) |
| Trade accounts payable | (1,895) | (2,101) | (1,729) |
| Income tax liabilities | (77) | (110) | (91) |
| Liabilities directly related to assets held for sale9 | – | – | – |
| Capital employed | 9,316 | 9,424 | 8,779 |
| Average capital employed | 9,550 | 9,370 | 9,102 |
1 Other financial assets were adjusted for nonoperating assets.
2 Other receivables were adjusted for nonoperating receivables.
3 Deferred tax assets were adjusted for deferred taxes from defined benefit plans and similar obligations recognized in other comprehensive income.
4 Assets held for sale were adjusted for nonoperating and financial assets.
5 Other provisions were adjusted for provisions for interest payments.
6 Other financial liabilities were adjusted for nonoperating liabilities.
7 Other nonfinancial liabilities were adjusted for nonoperating liabilities.
8 Deferred tax liabilities were adjusted for deferred tax liabilities from defined benefit plans and similar obligations recognized in other comprehensive income.
9 Liabilities directly related to assets held for sale were adjusted for nonoperating and financial debt.