Net Assets
| Summary statement of financial position | ||
|---|---|---|
| Dec. 31, 2024 | Dec. 31, 2025 | |
| € million | € million | |
| Noncurrent assets | 7,865 | 7,560 |
| Current assets | 5,766 | 5,907 |
| Total assets | 13,631 | 13,467 |
| Equity | 6,679 | 7,016 |
| Noncurrent liabilities | 3,376 | 2,584 |
| Current liabilities | 3,576 | 3,867 |
| Liabilities | 6,952 | 6,451 |
| Total equity and liabilities | 13,631 | 13,467 |
Total assets declined by €164 million from €13,631 million as of December 31, 2024, to €13,467 million as of December 31, 2025.
Noncurrent assets decreased by €305 million to €7,560 million (previous year: €7,865 million) and accounted for 56.1% (previous year: 57.7%) of total assets. This was mainly attributable to a decline in property, plant and equipment and in goodwill resulting from the recognition of impairment losses, among other things. This trend was partially offset by a rise in noncurrent other receivables.
Current assets were up €141 million to €5,907 million (previous year: €5,766 million), and their ratio to total assets was 43.9% (previous year: 42.3%). This increase is mainly attributable to higher current other financial assets as well as a rise in cash and cash equivalents. This was set against a decline in inventories and trade accounts receivable, which partially offset this trend.
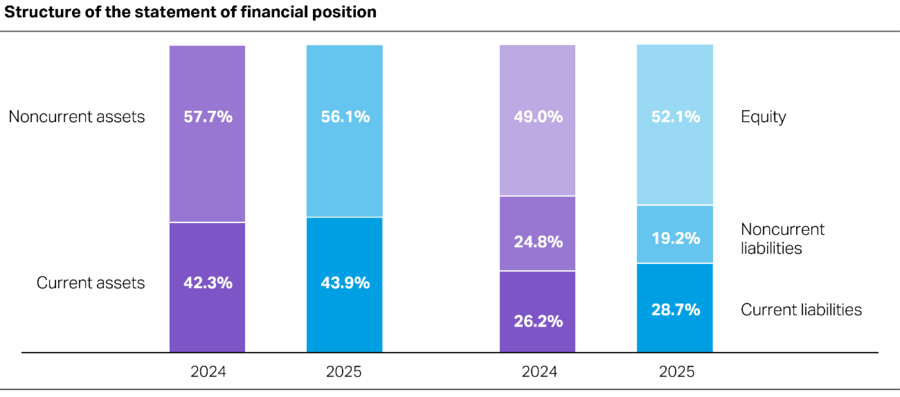
Equity as of December 31, 2025, increased by €337 million to €7,016 million (previous year: €6,679 million). The equity ratio at the reporting date was 52.1% (previous year: 49.0%). The rise in equity is primarily due to the capital increase implemented as part of the completion of the takeover by XRG. Equity was also boosted by higher gains on the remeasurement of the net defined benefit liability for post-employment benefit plans. These positive effects were countered by trends such as, in particular, the net loss after income taxes for fiscal 2025 as well as adverse exchange differences, which reduced equity accordingly.
Noncurrent liabilities went down by €792 million to €2,584 million as of the reporting date (previous year: €3,376 million) and accounted for 19.2% (previous year: 24.8%) of total capital and 40.1% (previous year: 48.6%) of liabilities. This is essentially attributable to a decrease in noncurrent financial debt due, among other reasons, to the reclassification of noncurrent to current financial debt.
| Net defined benefit liability for post-employment benefit plans | ||
|---|---|---|
| Dec. 31, 2024 | Dec. 31, 2025 | |
| € million | € million | |
| Provisions for pensions and other post-employment benefits | 387 | 252 |
| Net defined benefit asset | (72) | (168) |
| Net defined benefit liability | 315 | 84 |
The net defined benefit liability for post-employment benefits (provisions for pensions and other post-employment benefits less net defined benefit asset) was down by €231 million in the reporting year to €84 million (previous year: €315 million), primarily as a result of actuarial gains caused by the rise in discount rates in Germany. This trend was partially offset by losses on plan assets.
Current liabilities went up by €291 million to €3,867 million (previous year: €3,576 million) and therefore accounted for 28.7% (previous year: 26.2%) of total capital and 59.9% (previous year: 51.4%) of liabilities. This is essentially because of an increase in current financial debt due, among other reasons, to the reclassification of noncurrent to current financial debt already mentioned. This was primarily set against lower trade accounts payable.