Results of Operations
Sales
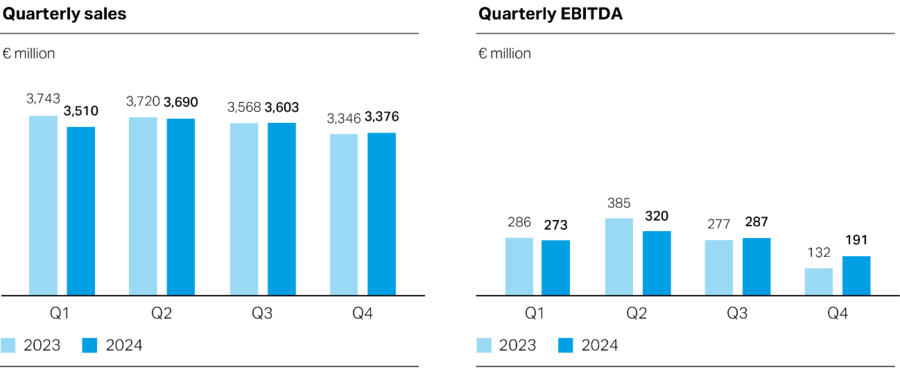
Group sales declined by 1.4% in fiscal 2024, to €14,179 million (previous year: €14,377 million). The decrease in sales was primarily attributable to a demand-related drop in the selling price level, accompanied by the decline in raw material prices being passed on to customers; these factors had a diminishing effect on sales of 8.0%. This was set against an increase in volumes sold, especially in the APAC and EMLA regions, which had a positive effect on sales of 7.4%. Furthermore, exchange rate movements had a decreasing effect on sales of 0.8%.
Sales in the Performance Materials segment were up 1.4% to €6,970 million in fiscal 2024 (previous year: €6,876 million). Sales in the Solutions & Specialties segment were down 3.6% to €7,004 million (previous year: €7,267 million).
In the EMLA region, sales were 1.6% lower, at €5,848 million (previous year: €5,941 million), while sales in the NA region were down 6.1% to €3,507 million (previous year: €3,735 million). Sales in the APAC region were up by 2.6% to €4,824 million (previous year: €4,701 million).
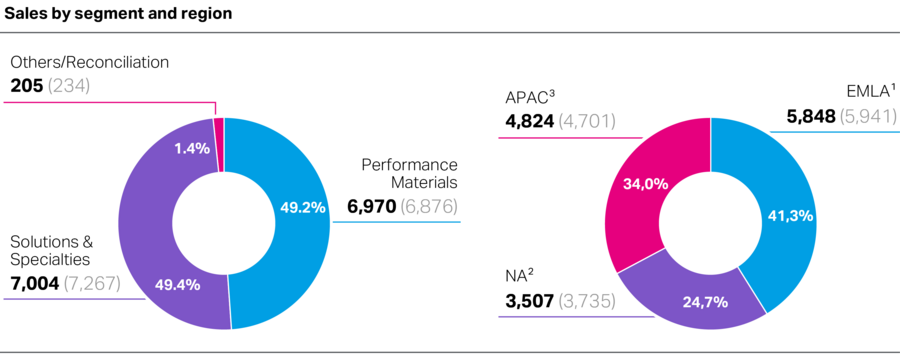
1 EMLA: Europe, Middle East, Latin America (excluding Mexico), Africa region.
2 NA: North America region (Canada, Mexico, United States).
3 APAC: Asia and Pacific region.
EBIT
| Summary consolidated income statement | |||
|---|---|---|---|
| 2023 | 2024 | Change | |
| € million | € million | % | |
| Sales | 14,377 | 14,179 | –1.4 |
| Cost of goods sold | (12,071) | (12,002) | –0.6 |
| Gross profit | 2,306 | 2,177 | –5.6 |
| Selling expenses | (1,489) | (1,513) | 1.6 |
| Research and development expenses | (374) | (392) | 4.8 |
| General administration expenses | (360) | (343) | –4.7 |
| Other operating expenses (–) and income (+) | 103 | 158 | 53.4 |
| EBIT | 186 | 87 | –53.2 |
| Financial result | (113) | (114) | 0.9 |
| Income before income taxes | 73 | (27) | . |
| Income taxes | (275) | (245) | –10.9 |
| Income after income taxes | (202) | (272) | 34.7 |
| attributable to noncontrolling interest | (4) | (6) | 50.0 |
| attributable to Covestro AG shareholders (net income) | (198) | (266) | 34.3 |
Cost of goods sold was down 0.6% to €12,002 million (previous year: €12,071 million), driven mainly by lower raw material and energy costs. Here, additional state subsidies of €55 million to compensate for electricity prices in Germany had a beneficial impact on energy costs. The ratio of the cost of goods sold to sales increased to 84.6% (previous year: 84.0%).
Gross profit fell 5.6% to €2,177 million (previous year: €2,306 million), This was primarily driven by a decline in selling prices, which was only partially offset by the drop in raw material and energy costs. In addition, impairment losses on property, plant and equipment and negative effects from exchange rate movements reduced earnings. On the other hand, the rise in volumes sold had a beneficial effect on earnings.
Selling expenses increased by 1.6% to €1,513 million (previous year: €1,489 million). The ratio of selling expenses to sales was 10.7% (previous year: 10.4%). Research and development (R&D) expenses were up 4.8% to €392 million (previous year: €374 million). As a share of sales, this produced an R&D ratio of 2.8% (previous year: 2.6%). General administration expenses declined 4.7% to €343 million (previous year: €360 million), for a ratio of administration expenses to sales of 2.4% (previous year: 2.5%).
The implementation of the transformation program STRONG gave rise to expenses in the low double-digit million euro range in the reporting year.
Other operating income exceeded other operating expenses by €158 million (previous year: €103 million). Within this item, insurance compensation of €55 million and the gain of €46 million on the sale of intangible assets had a positive effect on EBIT. In contrast, EBIT was down year-on-year as a non-recurring positive effect from the sale of the additive manufacturing business in the second quarter of 2023 had increased earnings by €35 million.
EBIT declined 53.2% to €87 million (previous year: €186 million). The EBIT margin retreated to 0.6% (previous year: 1.3%).
EBITDA
| Calculation of EBITDA | ||
|---|---|---|
| 2023 | 2024 | |
| € million | € million | |
| EBIT | 186 | 87 |
| Depreciation, amortization, impairment losses, and impairment loss reversals | 894 | 984 |
| EBITDA | 1,080 | 1,071 |
Depreciation, amortization, impairment losses, and impairment loss reversals rose by 10.1% to €984 million in fiscal 2024 (previous year: €894 million), of which €882 million (previous year: €801 million) was attributable to property, plant and equipment and €102 million (previous year: €93 million) to intangible assets. A significant driver of this increase was a rise in impairment losses to €142 million (previous year: €45 million), of which €106 million was recognized as a result of central impairment tests. There were no reversals of impairment losses (previous year: €0 million).
EBITDA decreased 0.8% year-over-year in the full-year period, declining to €1,071 million (previous year: €1,080 million). This was primarily attributable to the 9.4% drop in EBITDA, to €740 million (previous year: €817 million), in the Solutions & Specialties segment. The Performance Materials segment’s EBITDA was down 1.2% to €569 million (previous year: €576 million).
Net Income
In the fiscal year, the financial result stood at €–114 million (previous year: €–113 million) and largely consisted of net interest expense of €89 million (previous year: €90 million). In view of the financial result, income before income taxes went down to €–27 million (previous year: €73 million). Income tax expense amounted to €245 million in the reporting year (previous year: €275 million). It includes impairment losses of €46 million (previous year: €42 million) on deferred tax assets arising from loss carryforwards and temporary differences. Furthermore, deferred tax assets arising from loss carryforwards and temporary differences of €176 million (previous year: €197 million) could not be recognized in the fiscal year. After income taxes and noncontrolling interests, the net loss amounted to €266 million (previous year: €198 million).
Return on Capital Employed (ROCE) above Weighted Average Cost of Capital (WACC)
| Calculation of the ROCE above WACC | |||
|---|---|---|---|
| 2023 | 2024 | ||
| EBIT | € million | 186 | 87 |
| Imputed tax rate | % | 25.0 | 25.0 |
| Imputed taxes1 | € million | 47 | 22 |
| Net operating profit after taxes (NOPAT) | € million | 139 | 65 |
| Average capital employed | € million | 9,550 | 9,370 |
| ROCE | % | 1.5 | 0.7 |
| Weighted average cost of capital (WACC) | % | 7.6 | 8.1 |
| ROCE above WACC | % points | –6.1 | –7.4 |
1 The imputed income taxes used in the calculation of NOPAT are determined by multiplying EBIT by the imputed tax rate.
The Covestro Group’s NOPAT totaled €65 million (previous year: €139 million), and average capital employed amounted to €9,370 million (previous year: €9,550 million). The resulting ROCE was 0.7% (previous year: 1.5%), significantly lower than the increased WACC of 8.1% (previous year: 7.6%).
| Calculation of average capital employed | |||
|---|---|---|---|
| Dec. 31, 2022 | Dec. 31, 2023 | Dec. 31, 2024 | |
| € million | € million | € million | |
| Goodwill | 729 | 711 | 719 |
| Other intangible assets | 603 | 519 | 471 |
| Property, plant and equipment | 5,801 | 5,795 | 5,898 |
| Investments accounted for using the equity method | 185 | 182 | 269 |
| Other financial assets1, 2 | 21 | 14 | 17 |
| Other receivables2, 3 | 452 | 501 | 523 |
| Deferred tax assets4 | 277 | 248 | 209 |
| Inventories | 2,814 | 2,459 | 2,851 |
| Trade accounts receivable | 2,011 | 1,898 | 1,749 |
| Claims for income tax refunds | 115 | 102 | 92 |
| Assets held for sale5 | 18 | – | – |
| Gross capital employed | 13,026 | 12,429 | 12,798 |
| Other provisions6 | (349) | (548) | (599) |
| Other financial liabilities2, 7 | (136) | (114) | (118) |
| Other nonfinancial liabilities2, 8 | (258) | (228) | (247) |
| Deferred tax liabilities9 | (307) | (251) | (199) |
| Trade accounts payable | (2,016) | (1,895) | (2,101) |
| Income tax liabilities | (175) | (77) | (110) |
| Liabilities directly related to assets held for sale10 | (2) | – | – |
| Capital employed | 9,783 | 9,316 | 9,424 |
| Average capital employed | 9,785 | 9,550 | 9,370 |
1 Other financial assets were adjusted for nonoperating assets.
2 Prior-year figures adjusted. See the appropriate disclosures in the Notes to the Consolidated Financial Statements for further details.
3 Other receivables were adjusted for nonoperating receivables.
4 Deferred tax assets were adjusted for deferred taxes from defined benefit plans and similar obligations recognized in other comprehensive income.
5 Assets held for sale were adjusted for nonoperating and financial assets.
6 Other provisions were adjusted for provisions for interest payments.
7 Other financial liabilities were adjusted for nonoperating liabilities.
8 Other nonfinancial liabilities were adjusted for nonoperating liabilities.
9 Deferred tax liabilities were adjusted for deferred tax liabilities from defined benefit plans and similar obligations recognized in other comprehensive income.
10 Liabilities directly related to assets held for sale were adjusted for nonoperating and financial debt.