Solutions & Specialties
| Solutions & Specialties key data | ||||||
|---|---|---|---|---|---|---|
| 4th quarter 2023 | 4th quarter 2024 | Change | 2023 | 2024 | Change | |
| Sales (external) | €1,703 million | €1,654 million | –2.9% | €7,267 million | €7,004 million | –3.6% |
| Intersegment sales | €6 million | €7 million | 16.7% | €27 million | €27 million | 0.0% |
| Sales (total) | €1,709 million | €1,661 million | –2.8% | €7,294 million | €7,031 million | –3.6% |
| Change in sales (external) | ||||||
| Volume | –0.3% | 1.3% | –6.2% | 4.0% | ||
| Price | –10.2% | –4.0% | –6.4% | –6.8% | ||
| Currency | –3.3% | –0.2% | –2.5% | –0.8% | ||
| Sales by region (external) | ||||||
| EMLA | €586 million | €556 million | –5.1% | €2,730 million | €2,585 million | –5.3% |
| NA | €427 million | €420 million | –1.6% | €1,860 million | €1,755 million | –5.6% |
| APAC | €690 million | €678 million | –1.7% | €2,677 million | €2,664 million | –0.5% |
| EBITDA1 | €185 million | €150 million | –18.9% | €817 million | €740 million | –9.4% |
| EBIT1 | €107 million | €30 million | –72.0% | €497 million | €374 million | –24.7% |
| Cash flows from operating activities | €374 million | €368 million | –1.6% | €821 million | €671 million | –18.3% |
| Cash outflows for additions to property, plant, equipment and intangible assets | €110 million | €110 million | 0.0% | €270 million | €254 million | –5.9% |
| Free operating cash flow | €264 million | €258 million | –2.3% | €551 million | €417 million | –24.3% |
1 EBITDA and EBIT include the effect on earnings of intersegment sales.
Sales in the Solutions & Specialties segment were down 3.6% to €7,004 million in fiscal 2024 (previous year: €7,267 million). The main drivers of this trend were a 6.8% drop in average selling prices and negative changes in exchange rates of 0.8%. In contrast, an increase in volumes sold had a beneficial effect on sales of 4.0%.
The EMLA region’s sales went down by 5.3% to €2,585 million (previous year: €2,730 million), principally because of a considerable decline in average selling prices, which could only partially be offset by a slight rise in volumes sold. Exchange rate movements had no notable effect on sales. In the NA region, sales were down 5.6% to €1,755 million (previous year: €1,860 million), mainly on account of a slight decline in the selling price level. Exchange rate movements and changes in volumes sold had no notable effects on sales. Sales in the APAC region were down by 0.5% to €2,664 million (previous year: €2,677 million). This is mainly due to a significant drop in average selling prices and exchange rate movements that resulted in a slight decline in sales. These factors were, however, largely offset by a significant rise in volumes sold with a concomitant positive effect on sales.
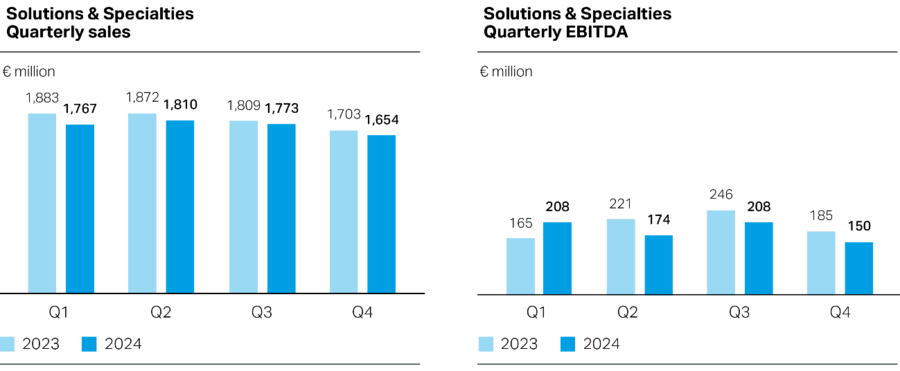
The Solutions & Specialties segment’s EBITDA was down 9.4% to €740 million in fiscal 2024 (previous year: €817 million). This was mainly driven by reduced margins, as lower raw material and energy costs were unable to fully offset the demand-related decline in selling prices. In addition, higher fixed costs had a negative effect on EBITDA. The previous year had also included a non-recurring positive effect from the sale of the additive manufacturing business, which had increased prior-year earnings by €35 million. The implementation of the transformation program STRONG gave rise to expenses in the low double-digit million euro range in the reporting year. Furthermore, a decline in the amount of business development subsidies received in China attributable to the segment as well as exchange rate movements had a decreasing effect on earnings. In contrast, a rise in volumes sold in particular had a positive impact on the Solutions & Specialties segment’s earnings.
EBIT dropped by 24.7% to €374 million (previous year: €497 million).
Free operating cash flow was down 24.3% to €417 million (previous year: €551 million), mainly because of a year-on-year decline in funds freed up from working capital and lower EBITDA. The change in working capital was predominantly due to a rise in inventories.